Track and learn what drives your inflammation
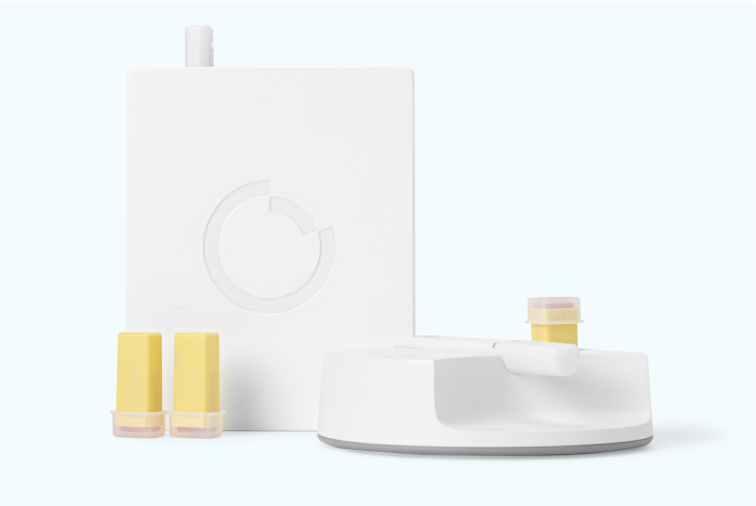
The COR One is the only at-home medical device to measure chronic and acute inflammation. From only a single drop of blood. Results you can share with your physician.
Buy NowHow it works
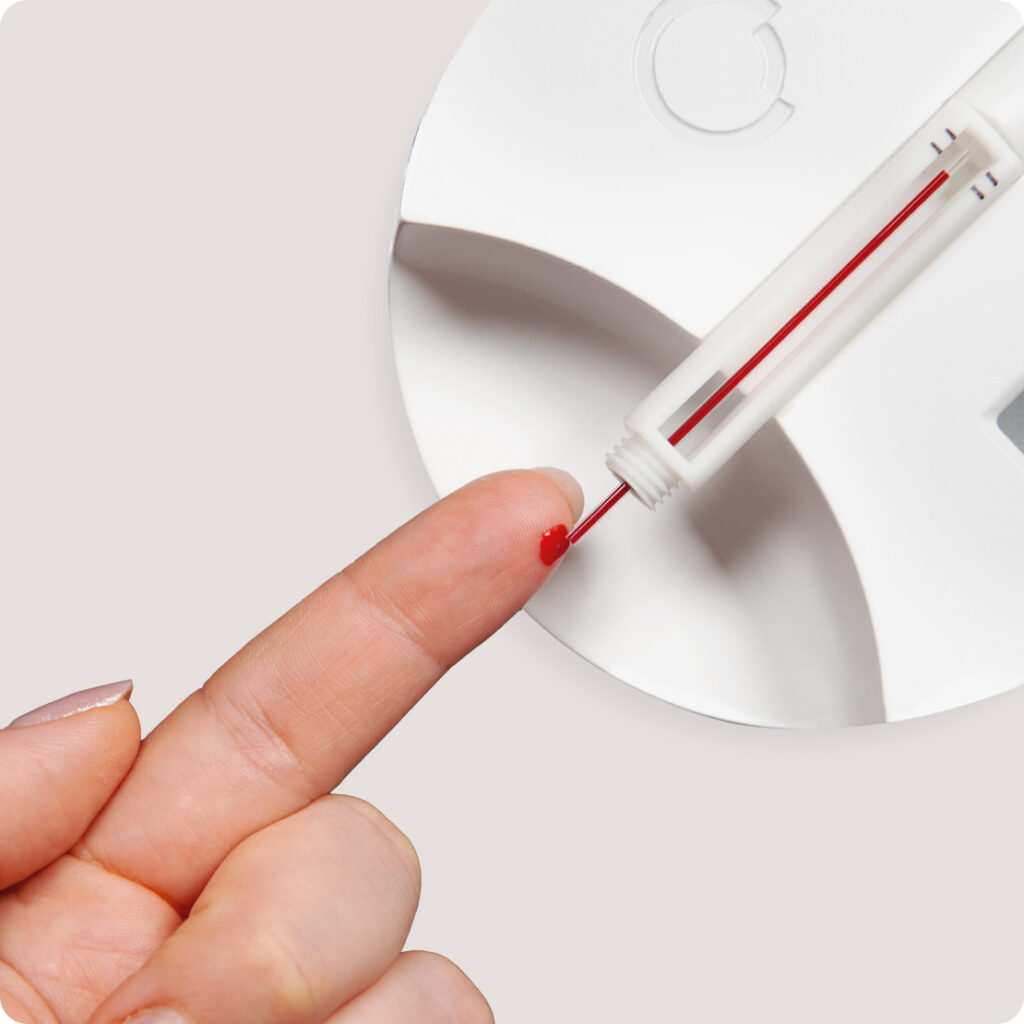
Perform Your Test
Perform a medically accurate test from the comfort of your own home.
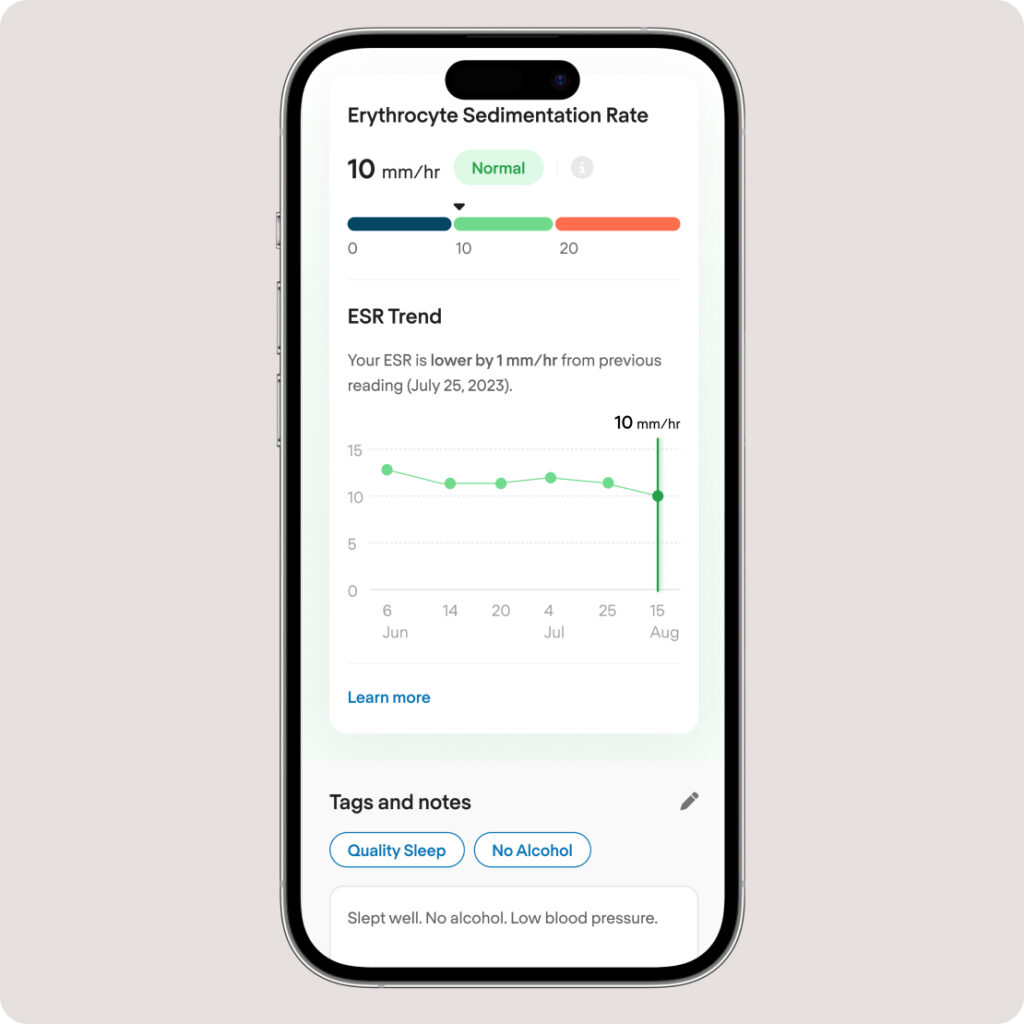
Save a Smart Note
Save notes and tags against your test using the COR app’s journaling feature.
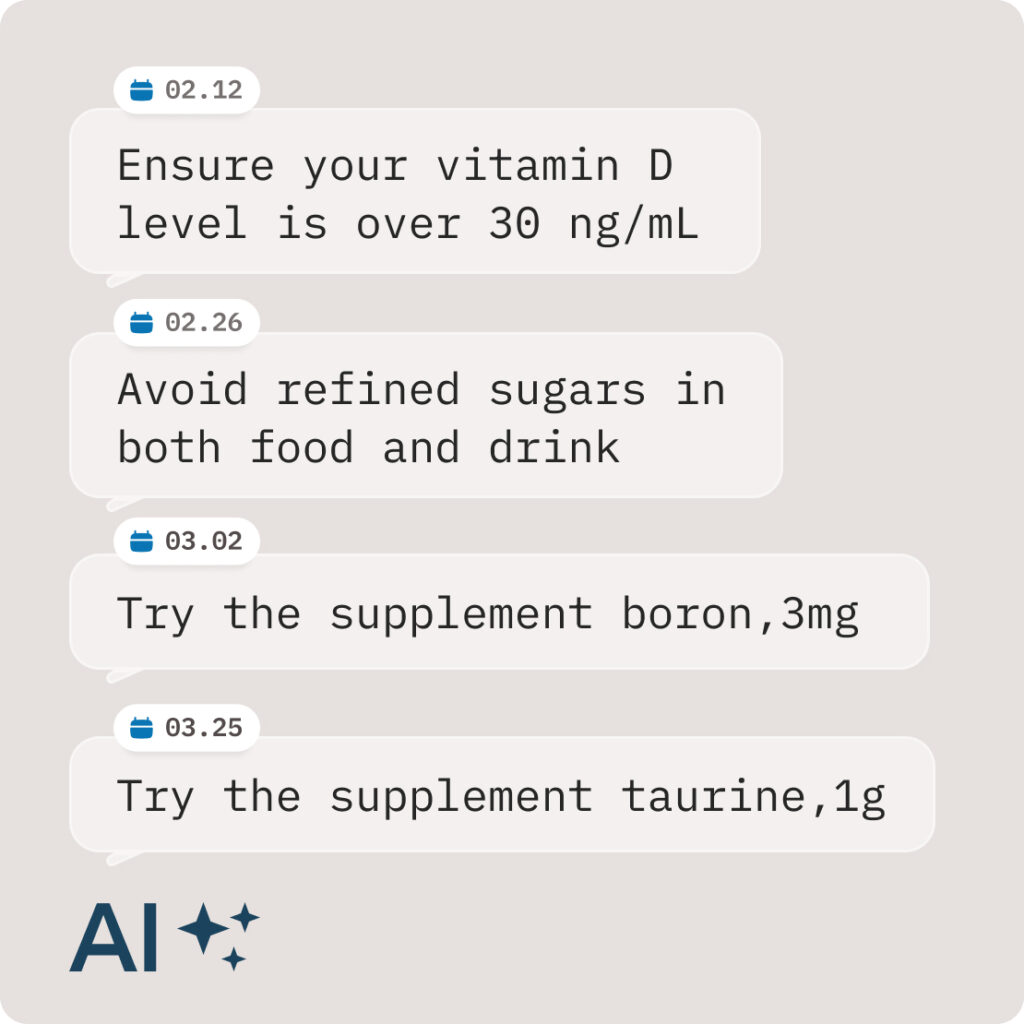
Get Smart Suggestions
AI will periodically make personalized suggestions to lower your inflammation.
Perform Your Test
Perform a medically accurate test from the comfort of your own home.
Save a Smart Note
Save notes and tags against your test using the COR app’s journaling feature.
Get Smart Suggestions
AI will periodically make personalized suggestions to lower your inflammation.

Medically accurate
Easily track your inflammation with the COR One – at home or away. The COR One measures the Erythrocyte Sedimentation Rate (ESR).
- ESR reflects more inflammatory pathways than hs-CRP or any other inflammatory marker.
- ESR is very sensitive at very low inflammation levels. So, it is ideal for chronic inflammation (“silent inflammation”).
- Until now, there’s not been a way to know if you’re living with low-grade chronic inflammation.
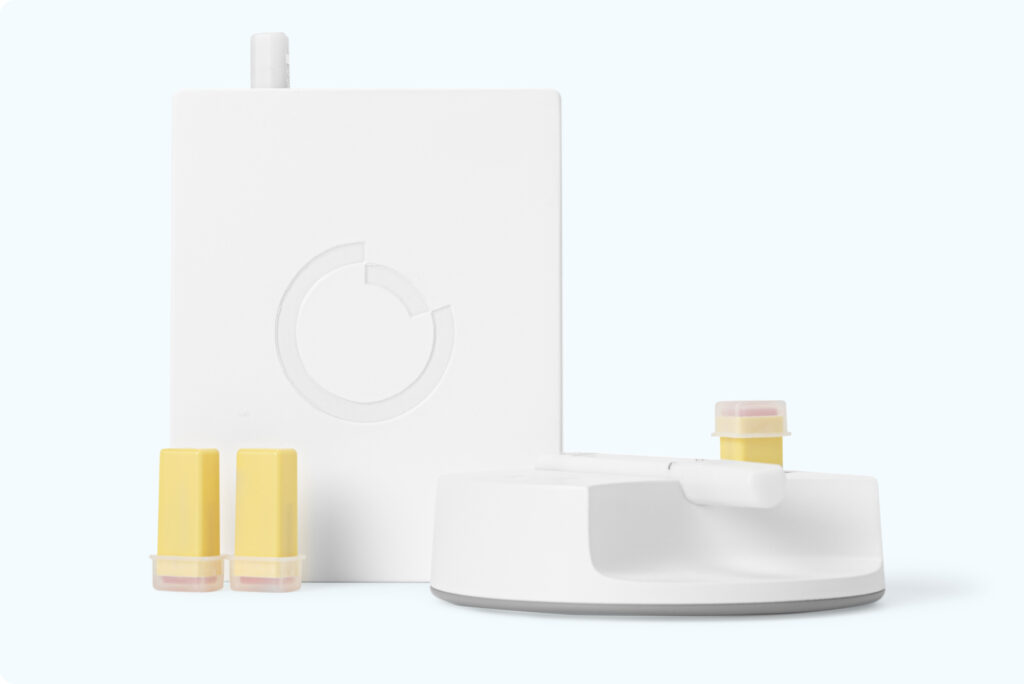
Affordable & convenient
Despite being medical grade, the COR One has a consumer-friendly price tag. It is USB-powered and extremely lightweight and compact.
- Taking tests at home is much cheaper than going to labs, with the added convenience.
- Low-cost testing enables “tracking.” That allows you to see the link between changes in inflammation and lifestyle.
- Results within 30 minutes.
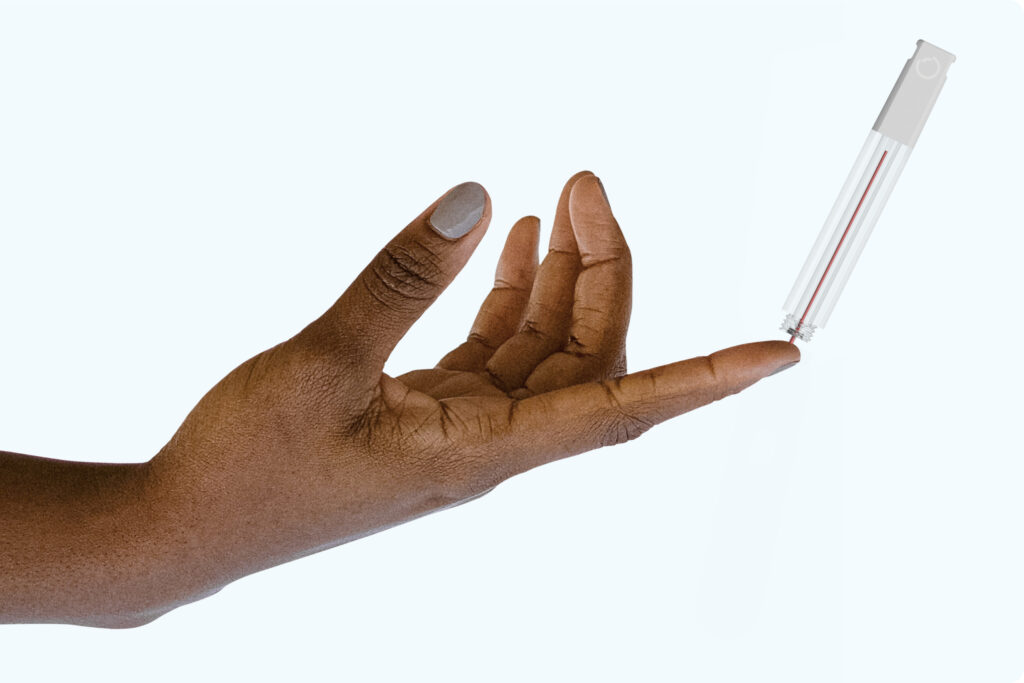
Painless blood collection
A lancet is used to get a drop of blood, like the one diabetics use for glucose readings. It is then collected into the COR Mini Test Tube.
- The lancet is the lightest gauge available.
- We provide a sample station (“the altar”) free of charge to make collection simple.
- Unlike at-home dry blood spot kits, you only need a single micro drop of blood.
Apple to COR
Bob Messerschmidt founded COR Health to bring inflammation tracking to everyone. After selling his previous company to Steve Jobs, he worked directly with Steve and others (such as Jony Ive) for several years as an Apple Watch Platform Architect. Bob and his team architected all the health sensors in the Apple Watch.
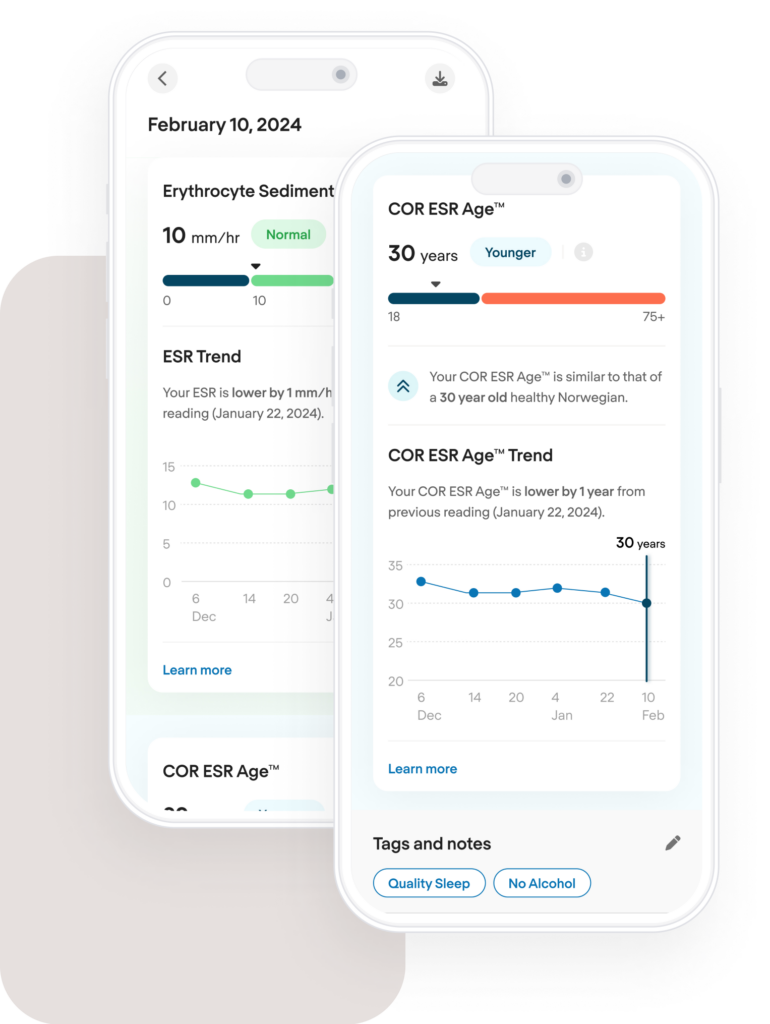
Track your inflammation
The COR dashboard helps you track inflammation for good health and a longer life, not just for diagnostics. It features the ability to add tags and notes to your results. You can also see if your result is “older” or “younger” for your age.
Testimonials


Love using the new Cor ESR device. Fun to be able to monitor inflammation levels as a result of a rough day at work or after a relaxing weekend
Testing a vital biomarker in the comfort of the home with a miniscule amount of blood. This is a meaningful step in the direction of the personalized medicine of the future!
The COR helped provide inflammatory insight on my nutrition and strenuous activity, which allowed me to optimize my workouts and diet based on the information I received from the device.
I do like the machine and testing and setup was easy.
Shopping Cart (0)
No products in the shopping cart
Tax included. Shipping calculated at checkout.
Get 10% off your first order
Sign up to offers and all the latest information on managing your own health and save 10% on your first device order.