Direct spectroscopic measurements in erythrocytes
to determine average blood pressure: a comparative study of a novel point-of-care device
Authors: Latha Palaniappan, MD, MS1, Thomas Quertermous, MD, PhD1 Paul B. Batchelder,2 Howland D. T. Jones,4 Robert G. Messerschmidt3
1Stanford University School of Medicine, Division of Cardiovascular Medicine
2Clinimark Laboratories
3Nueon Inc.
4HyperImage Solutions
Corresponding Author:
Latha Palaniappan, MD, MS, FAHA, FACC, FACP Clinical Professor of Medicine
Stanford University School of Medicine 1070 Arastradero Road, Suite 100 Palo Alto, CA 94304 lathap@stanford.edu
Abstract
Introduction: Average blood pressure over time may be a better alternative to office based blood pressure to diagnose hypertension
Materials and Methods: 11 subjects were recruited, and ~ 68 ambulatory blood pressure measurements were made per subject over 28 days. Washed red blood cells were measured on a Bruker Alpha Fourier Transform Infrared (FTIR) spectrometer. The collected frequency region spanned 700 – 2100 cm-1. We used the blood pressure data to build a spectroscopic calibration model using multivariate analysis methodologies to predict the average ambulatory blood pressure. We then performed a cross validation by leaving one prediction spectrum out during the calibration phase.
Results: The correlation of the average ambulatory systolic blood pressure with spectroscopic predicted blood pressure was 0.79. The standard error of prediction in the full model was 10.5 mmHg, and in cross validation was 12.7 mmHg. The precision across all subjects is 7.7 mmHg in the full model and 9.4 mmHg in the cross validated model.
Conclusions: This comparative study suggests that a spectroscopic measurement of the dried RBCs has the potential to measure the average blood pressure over time. This is the first report of a RBC spectroscopic analyzing device that can measure blood pressure.
Introduction
Hypertension or high blood pressure affects at least 1 billion people worldwide [1]. In the United States, 70 million American adults (29%) have high blood pressure (1 in 3 adults). Only about half of people with high blood pressure have their condition under control. Nearly 1 in 3 American adults has prehypertension—blood pressure that is higher than normal, but not yet in the high blood pressure range [2]. High blood pressure costs the US $46 billion each year. This includes cost of health care services, medications, and missed days of work [3].
Blood pressure is a powerful, consistent, and independent risk factor for cardiovascular disease and renal disease [4]. Since the Framingham Heart Study, it has been recognized that average (mean) blood pressure is the measurement most clearly related to morbid events [4].
Conventional clinic readings, when made correctly, are a surrogate marker for a patient’s true blood pressure, which is best conceptualized as the average level over prolonged periods of time, and which is thought to be the most important component of blood pressure in determining its adverse effects. In practice, clinic readings give a very poor estimate of average blood pressure over time [4]. It is also well recognized that the predictive power of multiple blood pressure determinations is much greater than a single office reading [4]. The 2015 United States Preventive Services Task Force guidelines on blood pressure screening recommends obtaining blood pressure measurements outside of the clinical setting for diagnostic confirmation before starting treatment [5]. Although ambulatory blood pressure (ABP) monitoring provides a way to measure mean blood pressure [5], these devices are cumbersome and inconvenient, and therefore not widely used.
Analysis of the red blood cell may provide a better alternative to conventional clinic blood pressure readings in identifying long term hypertension. The deformability of the human red blood cell (RBC) results from the dynamic interaction of the phospholipid bilayer plasma membrane and the structural spectrin molecular network. The membrane of the erythrocyte undergoes molecular changes (remodeling) in hypertension. These changes appear to be a response to increased shear forces on the at-risk cells as blood pressure increases.
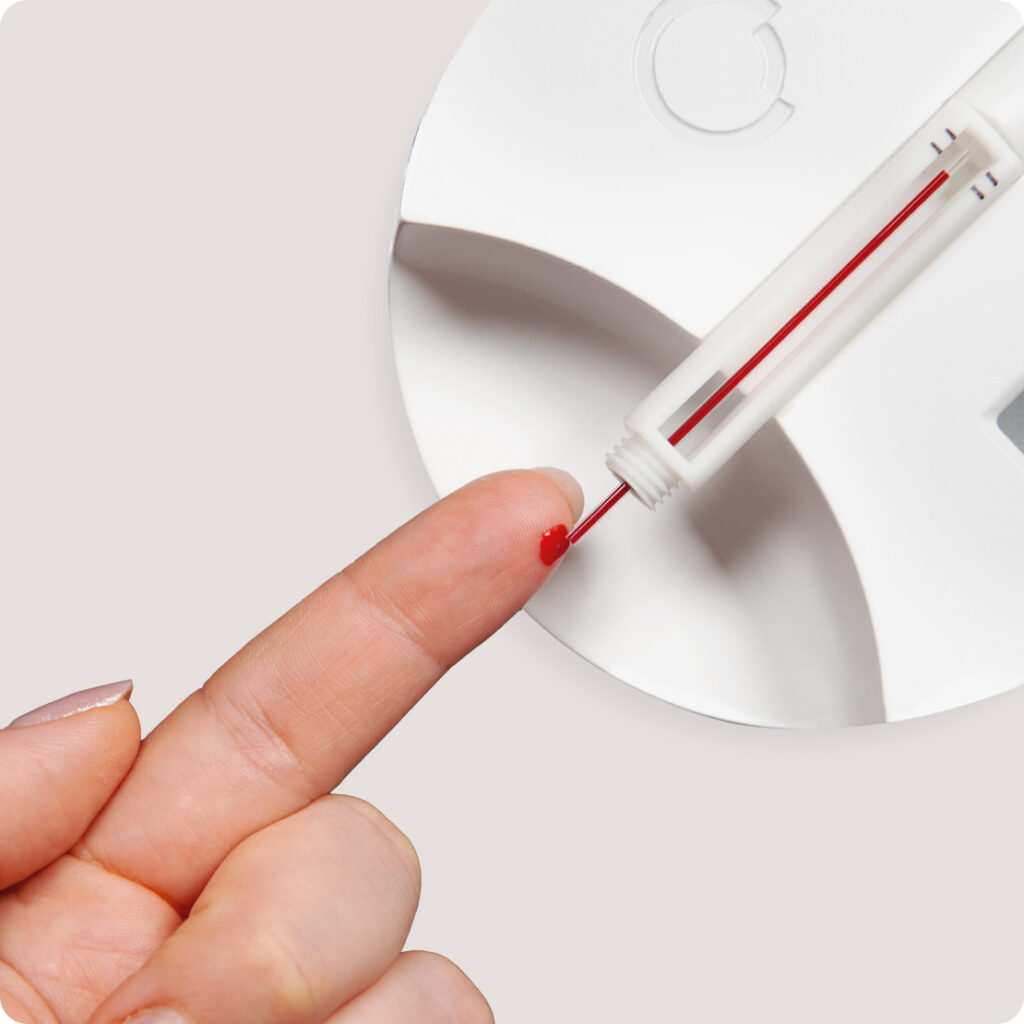
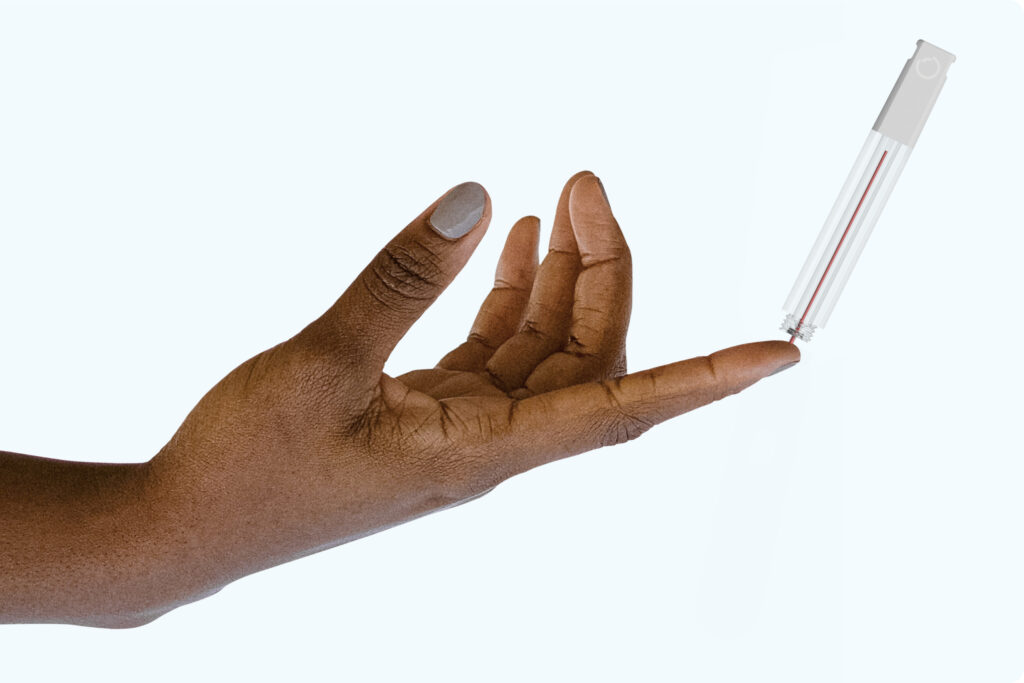
Nueon Inc. is developing a technology that will interrogate the red blood cell using a guided wave optical measurement, and a biostatistical model to correlate these optical changes to a particular medical condition, diagnosis, or vital sign. The goal of the Nueon technology is to query the severity and history of hypertension over the 100-day lifetime of the red blood cell. The aim is to make this measurement at the point of care, using a single blood drop from a fingerstick, using an inexpensive instrument, that provides results obtained in one minute.
Blood chemistry is the gold standard for assessing health and wellness. Biomarkers in blood serum are very valuable medically, but many exist only in trace (nanomolar) quantities. Red blood cells are plentiful, and so a highly specific analytical method which focuses on the red blood cell can be easily employed. Red blood cells in number comprise about 1/4 of all the cells in the body. The plasma membrane that surrounds these red cells is highly accessible to a reagentless, guided wave optical interrogation.
In terms of clinical utility, the Nueon spectroscopic test has a strong similarity to the hemoglobin A1C test. The Nueon technology has the potential to provide feedback about the 3 month history of blood pressure, rather than a single point value. The Nueon technology can help
provide data to drive engagement on diet and medication compliance, in the quest for prevention and wellness.
Objectives of the Clinical Validation Study
The purpose of this study was to evaluate blood pressure variations in 11 subjects across a range of blood pressure values. Of the 11 subjects, 8 had high blood pressure (systolic 140- 170 mmHg / diastolic 90-120 mmHg) 1 had prehypertension (systolic 120-139 mmHg / diastolic 80–89 mmHg) and 3 had normal blood pressure (systolic 100-119 mmHg / diastolic 70-79 mmHg). Patients were classified as hypertensive (n = 7) or normotensive (n = 3) according to their average systolic blood pressure value. Average cuff blood pressure readings over 4 weeks were then used to develop a spectroscopic calibration model to predict average blood pressure.
Methods
Study Design
This study was a comparative, single-center, non-randomized, study in 11 subjects conducted from January 12, 2015 to Feb 10, 2015. This study was approved by the Avista Adventist Institutional Review Board in Louisville, CO, USA. The subjects were recruited by advertisement, signed an IRB approved informed consent, and were compensated $650 for their participation in the study. The study duration was 4 weeks (28 days), and at least one blood pressure was taken each day. On 8 of the 28 days, 6 blood pressures were taken throughout the day (see Appendix).
The subjects were trained in the use of a Welch Allyn ABPM6100 Blood Pressure Monitor which is designed for 24hr blood pressure monitoring. Subjects recorded the BP readings as well as salient information regarding daily activities in a log book. Upon arising every morning, the subjects took a daily blood pressure. Two days each week the subjects wore the Welch Allyn device for a 24-hour period, during which 6 blood pressure readings were measured throughout the day. The 6 blood pressure readings were spaced approximately 3 hours apart: #1 ~7AM, #2
~ 10AM, #3 ~ 1PM, #4 ~ 4PM, #5 ~ 7PM, #6 ~ 10PM. The days of the week for the 24-hour data collection differed each week.
Sample Preparation
Venous blood samples were obtained in dipotassium-ethylenediaminetetraacetic acid (EDTA) vacutainer tubes weekly over 5 weeks at the study site in Colorado. Samples were shipped overnight to the Red Blood Cell (RBC) lab at Children’s Hospital Oakland Research Institute (CHORI) in California where samples were prepared and measured. Samples (1.5 – 2 mL) were centrifuged at 1000 x g for 3 minutes, plasma and buffy coat were removed. Saline (8mL) was added to the packed cells, and centrifuged three times at 1000 x g for 3 minutes, and supernatant removed. 1 ml Phosphate Buffered Saline (PBS) (0.1 µm sterile filter 0.2g/L KH2PO4, 2.16 g/L Na2HPO47H2O, 0.2g/L KCl 8g/L NaCl) was added to 0.5 ml washed/packed RBC. Hematocrit was determined and PBS was added until hematocrit was diluted to 20+/-2%.
Sample Measurement
The washed blood samples were measured on a Bruker Alpha Fourier Transform Infrared (FTIR) spectrometer using a Harrick ATR accessory (30-degree Silicon crystal). A 25 µl aliquot of the washed red blood cells was placed on the ATR optical surface and FTIR measurements continued until the sample was completely dry. Once dry, an additional minute of data collection was conducted and this spectrum was used for the calibration model building process. All sample spectra were ratioed to an air background collected close in time to the sample to create absorbance spectra. The air background consisted of sample-free cleaned optical surface. The collected frequency region spanned the so-called fingerprint region of the spectrum (700 – 2100 cm-1). Information in this spectral region is associated with resonant vibration, and therefore energy absorption of specific wavelengths that can be referenced to specific molecular bond vibration modes.
Transition
Metal - Carbonyl Band - 100x
Figure 1. The red blood cell absorbance spectrum. The carbonyl band increases in intensity with increasing blood pressure.
Results
The demographic characteristics of the study subjects is shown in Table 1. Table 1: Demographic characteristics of Subjects
Number of subjects completing the study |
11 |
Male/Female |
7/4 |
Age range |
22-64 |
Hypertensive/Normotensive |
8/3 |
Average Systolic BP range |
111-192 |
Total Systolic BP range |
88-228 |
The accumulated data set contains multiple blood pressure cuff readings over a 28-day study. There exist ~68 readings per subject and these values are used to derive one average systolic blood pressure for each subject which we define as the reference systolic blood pressure.
Figure 1 shows an example spectrum of the red blood cells. We observed several changes in the spectrum that correlated with blood pressure. There were shifts in of the amide bands, which may indicate changes in the protein secondary structure, and there were also changes in the carboxylate region of the spectrum. The most significant spectral feature that is correlated with blood pressure is located at approximately 1970 cm-1. This feature is related to a transition metal carbonyl band (i.e. located in hemoglobin).
We used the blood pressure data to build a spectroscopic calibration model using multivariate analysis methodologies (Augmented Classical Least Squares) [6-8] to predict the average blood pressure from the set of cuff readings. The prediction results were produced by predicting each of the average BP data points for each subject over 5 weeks that were used to in the development of this calibration model (full model). These results are presented in Table 2 below. The standard error of the full model was 10.5 mmHg. We then performed a cross validation by leaving one prediction spectrum out during the calibration model building process. The standard error of prediction during cross validation was 12.7 mmHg (Table 2). These results were enhanced by using a Genetic Algorithm procedure to downselect frequencies and only use the frequencies in the calibration model that correlated best with blood pressure (similar to Nordling et al. [9]). We also determined the within-subject precision between the 5 blood measurements made weekly during the 28 day study. The precision across all subjects is
7.7 mmHg in the full model and 9.4 mmHg in the cross validated model.
Table 2: Standard Error and Precision in the Full Model and the Cross Validated Model
Predict average BP |
Standard error |
Precision |
Full model |
10.5 mmHg |
7.7 mmHg |
Cross validation |
12.7 mmHg |
9.4 mmHg |
We observed a positive correlation of the average systolic blood pressure over time with the spectroscopically predicted blood pressure (Figure 2), with an R2 of 0.79.
Systolic Pressure (mmHg)
230
R² = 0.78723
210
190
170
150
130
110
90
100
110
120
130
140
150
160
170
180
190
200
Reference Blood Pressure (mmHg)
Predicted Blood Pressure (mmHg)
Figure 2: Correlation of Average Systolic Blood Pressure (Reference) with the Spectroscopic Cross-Validated Predicted Blood Pressure (Predicted)
We next wanted to determine if our model could properly classify the hypertensive and normotensive subjects in the study. There were 3 normotensive and 7 hypertensive subjects. The results are shown in Figure 3. We can properly classify all normotensive and hypertensive subjects in this study at a 95% confidence level (p < 0.05) using both the full calibration systolic results as well as the cross-validated systolic results (shown).
Figure 3. Normal vs hypertensive subjects in the clinical trial are properly classified. The median BP for each class is shown. The error bars show the 95% confidence intervals (p < 0.05) about the median values.
Discussion
Previous literature describes studies involving the study of red blood cells using Raman (laser) spectroscopy [10,11]. Although traditional infrared spectroscopy and Raman spectroscopy produce similar spectroscopic bands in the fingerprint region (700-2100 cm-1), infrared spectroscopy has advantages of decreased cost and increased portability. Our study showed that the most significant spectral feature correlated with blood pressure is located at approximately 1970 cm-1. This feature is related to a transition metal carbonyl band, likely located in hemoglobin. This spectral feature may be related to a spectrin-hemoglobin complex which literature suggests is responsible for red blood cell membrane rigidity [12]. Our small comparative study found a modest correlation with systolic blood pressure, and a good classification between normal and hypertensive subjects using this new spectroscopic technique.
Previous studies have shown that mechanical forces that affect red blood cell membrane morphology can also affect oxygen carrying capacity [11]. This mechanochemical change may explain in part the decreased aerobic capacity observed in patients with hypertension [13].
Most of the spectroscopic studies of changes in the red blood cell membrane to date have been done in patients with hemoglobin disorders, such as sickle cell anemia [10] or thalassemia [14]. We describe in this study a novel application of spectroscopy for patients in distinguishing the mechanochemical effects of high blood pressure on the red blood cell membrane.
Our pilot comparative study has many limitations, including small sample size. Given the small number of subjects, we were unable to control for many important confounders including but not limited to, age, gender, race/ethnicity, smoking, diabetes, and medication use. The importance
of confounders is evident from the wide range of within subject variability observed in Figure 2, indicating that there may be model errors with the current calibration. The precision is significantly better than the accuracy (standard error), which may indicate that there is still some reference error that is inflating the prediction errors. Subjects were volunteers from a single clinical site, which limits the generalizability of our findings. Although a cross-validation was performed to test the model performance, a separate calibration model built separate in time from the prediction sample set provides the best insight into future looking performance. Future studies will attempt to address these issues with a larger, longitudinal sample, a more diverse patient population, and adjustment for important confounders.
Conclusion
The average blood pressure over periods of time is thought to be the most important component of blood pressure in determining adverse events, and is an accepted predictor for morbidity and mortality due to hypertension. This comparative study suggests that a spectroscopic measurement of the dried RBCs has the potential to measure the average blood pressure over time. This is the first report of a blood analyzing device that can measure blood pressure.
Acknowledgements
We would like to recognize the contributions of Frans Kuypers, Ph.D. for helpful discussions and Sandra K. Larkin, MS, for processing and analysis of the blood samples, both are with CHORI (Children's Hospital of Oakland Research Institute).
Appendix:
The schedule for multiple blood pressure readings was as follows:
|
Monday |
Tuesday |
Wednesday |
Thursday |
Friday |
Saturday |
Sunday |
Week 1 |
6 BP’s |
1 |
1 |
1 |
1 |
6 BP’s |
1 |
Week 2 |
1 |
6 BP’s |
1 |
1 |
1 |
1 |
6 BP’s |
Week 3 |
1 |
1 |
6 BP’s |
1 |
6 BP’s |
1 |
1 |
Week 4 |
1 |
1 |
1 |
6 BP’s |
1 |
1 |
6 BP’s |
References
-
PM Kearney, M Whelton, K Reynolds, P Muntner, PK Whelton, J He. Global burden of hypertension: analysis of worldwide data, Lancet. 365 217-223.
-
T Nwankwo, SS Yoon, V Burt, Q Gu. Hypertension among adults in the United States: National Health and Nutrition Examination Survey, 2011-2012, NCHS Data Brief. (2013) 1-8.
-
D Mozaffarian, EJ Benjamin, AS Go, DK Arnett, MJ Blaha, M Cushman, et al. Heart disease and stroke statistics--2015 update: a report from the American Heart Association, Circulation. 131 (2015) 29.
-
TG Pickering, JE Hall, LJ Appel, BE Falkner, J Graves, MN Hill, et al. Recommendations for blood pressure measurement in humans and experimental animals: part 1: blood pressure measurement in humans: a statement for professionals from the Subcommittee of Professional and Public Education of the American Heart Association Council on High Blood Pressure Research, Circulation. 111 (2005) 697-716.
-
AL Siu. Screening for high blood pressure in adults: U.S. Preventive Services Task Force recommendation statement, Ann. Intern. Med. 163 (2015) 778-786.
-
DK Melgaard, DM Haaland, CM Wehlburg. Concentration Residual Augmented Classical Least Squares (CRACLS): A Multivariate Calibration Method with Advantages over Partial Least Squares, Appl Spectrosc. 56 (2002) 615-624.
-
DM Haaland, DK Melgaard. New augmented classical least squares methods for improved quantitative spectral analyses, Vibrational Spectroscopy. 29 (2002) 171-175.
-
DM Haaland, DK Melgaard. New Prediction-Augmented Classical Least-Squares (PACLS) Methods: Application to Unmodeled Interferents, Appl Spectrosc. 54 (2000) 1303-1312.
-
TEM Nordling, J Koljonen, JT Alander, P Geladi, Genetic Algorithms as a Tool for Wavelength Selection, 3 (2004) 99-113.
-
R Liu, Z Mao, DL Matthews, C Li, JW Chan, N Satake. Novel single-cell functional analysis of red blood cells using laser tweezers Raman spectroscopy: application for sickle cell disease, Exp. Hematol. 41 (2013) 661.e1.
-
M Wojdyla, S Raj, D Petrov. Absorption spectroscopy of single red blood cells in the presence of mechanical deformations induced by optical traps, J Biomed Opt. 17 (2012) 97006- 97001.
-
A Dong, RG Messerschmidt, JA Reffner, WS Caughey. Infrared spectroscopy of a single cell--the human erythrocyte, Biochem. Biophys. Res. Commun. 156 (1988) 752-756.
-
T Kishida, R Inaba, H Iwata. [Relationships between maximal oxygen uptake (VO2max) and physical activity, blood pressure and serum lipids], Nihon Eiseigaku Zasshi. 52 (1997) 475- 480.
-
AC De Luca, G Rusciano, R Ciancia, V Martinelli, G Pesce, B Rotoli, et al. Spectroscopical and mechanical characterization of normal and thalassemic red blood cells by Raman Tweezers, Opt Express. 16 (2008) 7943-7957.